Preliminary Findings: How Humans Detect AI-Generated Phishing Across 2,511 Classifications
Findings from 153 participants classifying AI-generated phishing: technique-level bypass rates, overconfidence patterns, and what security training misses.
Phishing accounts for 16% of confirmed breaches in the most recent Verizon DBIR and figures prominently in the 60% of breaches involving a human element. AI-generated phishing has matched human expert effectiveness in controlled studies (Heiding et al., 2024; Bethany et al., 2025), but the research base on which security awareness training is built still largely measures detection performance against pre-AI stimuli. We do not yet have reliable empirical data on which phishing techniques bypass trained humans when writing quality is no longer a distinguishing signal.
This post presents preliminary descriptive findings from an ongoing study designed to address that gap. 153 participants. 2,511 email classifications. Six phishing technique categories, all AI-generated at consistent linguistic quality. The study protocol is published on Zenodo. Previous snapshots covered 56 participants and 100 participants.
Everything below is descriptive. The formal mixed-effects model specified in the study protocol has not been run. No inferential statistics, no confidence intervals, no pairwise comparisons. What follows are raw patterns that have been stable across three successive snapshots with increasing sample sizes. Some will hold up under formal analysis. Some will shift once the model accounts for participant-level variation, card-level difficulty, and within-study learning effects.
Key takeaways
For readers who want the headline findings before the detail:
-
The techniques training focuses on are the easiest to catch. Credential harvest (12.1% bypass) and urgency (15.0%) are detected most reliably. Hyper-personalization, fluent prose, and authority impersonation cluster near 20% bypass. Training emphasis appears inverted relative to where detection actually fails.
-
People are confidently wrong. 60.5% of phishing misses were made at the highest confidence level (CERTAIN). This is not a guessing problem. It is an overconfidence problem. The techniques that produce the most confident errors are credential harvest (70% CERTAIN when wrong) and urgency (67%), the two techniques people are most trained to recognize.
-
Security experience helps less than expected. Raw phishing detection rates: infosec 84.2%, technical 84.7%, other 80.0%. Signal detection theory reveals security professionals have better discrimination (d'=2.43 vs. 1.97) but also more conservative response bias, and the two effects partially cancel in raw accuracy.
-
Removing forensic headers did not hurt accuracy. A mid-study methodology change created a natural experiment. Phase 2 (headers removed) accuracy was 85.9% vs. Phase 1 (headers visible) at 84.3%. Authentication status was confounding the measurement rather than aiding it.
-
The game-based format produces measurable learning. Accuracy improved 3.7 percentage points from Session 1 to Session 2, then plateaued. URL inspection correlates with accuracy (+12.5pp), but the benefit varies dramatically by technique (authority impersonation +13pp, fluent prose +1pp).
-
Slowing down does not help. Wrong answers take slightly longer than correct ones (41.7s vs. 37.4s median). The emails that fool people are not the ones they rush. They are the ones that genuinely look legitimate.
Everything below expands on these findings with full data, methodology notes, and limitations.
Study design in brief
Threat Terminal is a game-based research platform where participants classify AI-generated emails as phishing or legitimate. Every card in the dataset, both phishing and legitimate, is AI-generated using models from the Anthropic Claude family. This holds writing quality roughly constant across conditions, so that technique structure rather than linguistic quality drives detection difficulty.
The dataset contains 1,000 cards: 690 phishing across six technique categories and 310 legitimate across three categories (transactional, marketing, workplace). Each phishing technique has four difficulty tiers: easy, medium, hard, and extreme. The six phishing technique categories, defined in detail in the study protocol:
- Urgency. Artificial time pressure forcing fast decisions (expiring accounts, unprocessed payments, looming deadlines).
- Authority Impersonation. Messages impersonating executives, IT, HR, legal, or established institutions. All sender names are plausible, not obviously spoofed.
- Credential Harvest. Classic credential phishing directing recipients to a login, verification, or account recovery flow. The technique most consistently covered by security awareness training.
- Hyper-personalization. Emails referencing contextually plausible personal or professional detail to establish authenticity. Cards use plausible detail, not real participant information.
- Pretexting. Multi-step social engineering establishing a believable backstory before making the ask. The email arrives as a continuation of an implied prior interaction.
- Fluent Prose. Phishing with no urgency, no authority figure, no personalization, and no pretext. Polished, neutral business language making a routine request. This category serves as the study's control condition for technique salience: it measures detection difficulty when no identifiable social engineering structure is present. Participants complete up to three sessions of 10 cards each (30 classifications maximum in Research Mode), reporting a classification (phishing or legitimate) and a confidence level (GUESSING, LIKELY, or CERTAIN) for each email.
A methodological change was implemented mid-study. The protocol addendum v1.1 removed email authentication headers (SPF/DKIM/DMARC), Reply-To field analysis, and certain other forensic signals from the platform interface effective March 22, 2026. The rationale is documented in the addendum: authentication status was confounded with difficulty tier, and some participants unfamiliar with email authentication were confused by the indicators. This creates two distinct data collection phases that are analyzed separately below.
The dataset at 153 participants
| Metric | Value |
|---|---|
| Participants | 153 |
| Total classifications | 2,511 |
| Phishing classifications | 1,738 (69.2%) |
| Legitimate classifications | 773 (30.8%) |
| Overall accuracy | 84.9% |
| Phishing detection rate | 83.0% |
| Legitimate identification rate | 89.1% |
| False positive rate | 10.9% |
| Background | Participants | % of Sample |
|---|---|---|
| Infosec / Cybersecurity | 75 | 49.0% |
| Other (general users) | 37 | 24.2% |
| Technical / Non-security | 26 | 17.0% |
| Prefer not to say | 15 | 9.8% |
Completion depth varies. Of 153 participants, 56 completed 21 or more cards (37%), 22 completed 11 to 20 cards (14%), and 75 contributed 10 or fewer classifications (49%). 52 participants completed the full 30-card research allotment. This is typical for voluntary online studies and consistent with the pilot data. The mixed-effects model handles unbalanced participation natively.
The sample skews toward security awareness. Nearly half of participants self-report an infosec background. Findings should be interpreted as measuring classification performance within the Threat Terminal environment by a recruited convenience sample, not as estimates of real-world phishing detection in a general workforce.
Which techniques bypass human detection
This is the central finding.
Bypass rate is the percentage of phishing emails incorrectly classified as legitimate. Higher means harder to detect.
| Technique | Bypass Rate | Missed / Total |
|---|---|---|
| Hyper-personalization | 19.8% | 51 / 258 |
| Fluent Prose | 19.7% | 53 / 269 |
| Authority Impersonation | 19.4% | 62 / 319 |
| Pretexting | 16.4% | 49 / 299 |
| Urgency | 15.0% | 48 / 320 |
| Credential Harvest | 12.1% | 33 / 273 |
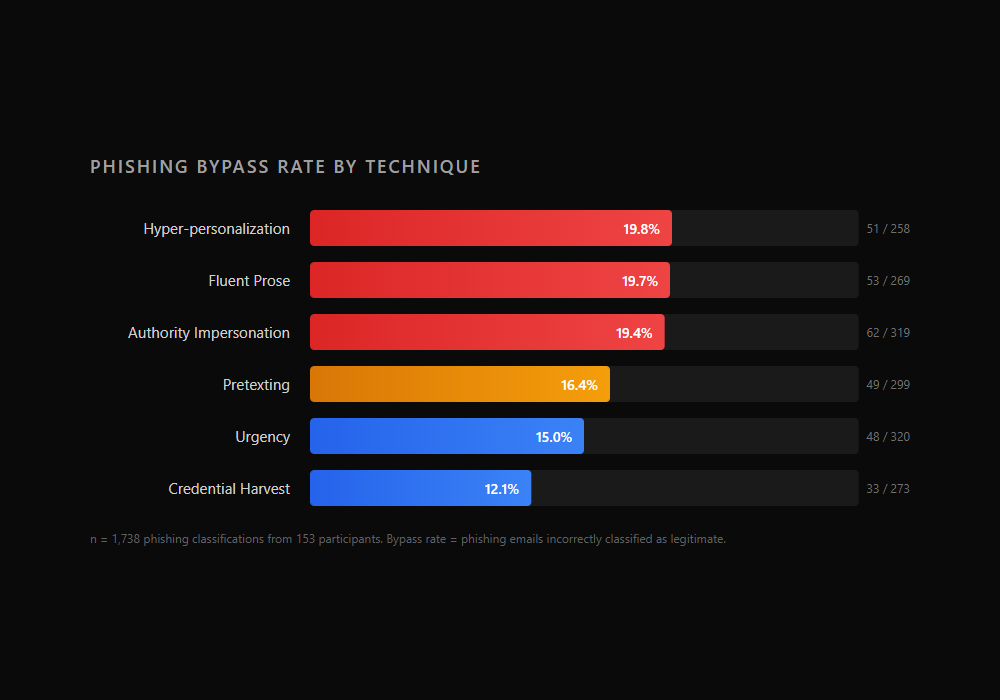
Three techniques cluster tightly at the top: hyper-personalization (19.8%), fluent prose (19.7%), and authority impersonation (19.4%). The gaps between them are too small to distinguish without formal testing. Below them, pretexting (16.4%) and urgency (15.0%) form a middle tier. Credential harvest sits clearly at the bottom at 12.1%.
The ordering has been stable across all three snapshots of this data. At 56 participants, fluent prose led at 21.3% and credential harvest trailed at 6.2%. At 100 participants, hyper-personalization led at 21.6% and credential harvest was at 12.2%. The top-three and bottom-two groupings have been consistent throughout. The magnitudes have shifted as the sample grew but the relative positions have not.
The protocol hypothesized that pretexting would produce the highest bypass rate among the five named techniques, with credential harvest producing the lowest. The raw data does not match the pretexting prediction. Whether the differences between adjacent techniques are statistically significant remains unknown until the formal model runs.
The pattern that matters most for practitioners: the two techniques most heavily covered by traditional security awareness training, credential harvest and urgency, are the two participants detect most reliably. The techniques that training spends less time on, or ignores entirely, are the ones that get through.
The difficulty gradient and dangerous combinations
| Difficulty | Bypass Rate | n |
|---|---|---|
| Easy | 14.6% | 519 |
| Medium | 13.6% | 521 |
| Hard | 22.6% | 535 |
| Extreme | 17.2% | 163 |
Easy and medium cluster together. Hard shows the highest bypass rate. The hard-to-extreme drop (22.6% to 17.2%) has persisted since the 100-participant snapshot and may reflect the smaller extreme sample or characteristics of extreme-tier cards that trigger more suspicion despite their technical difficulty.
The interaction between technique and difficulty reveals the most dangerous combinations in the dataset.
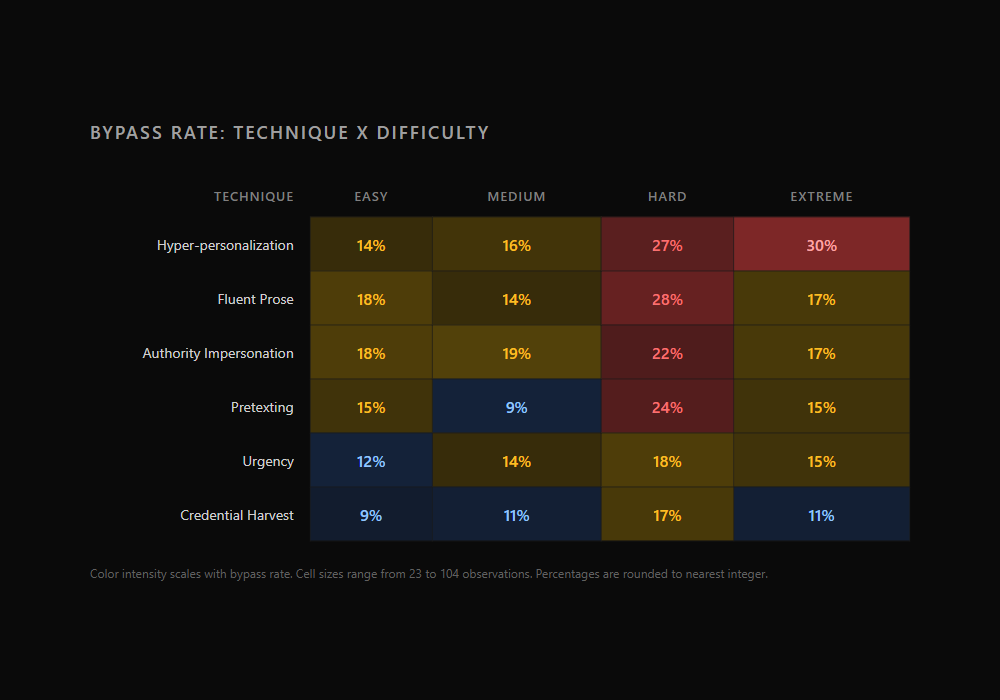
| Combination | Bypass Rate | n |
|---|---|---|
| Hyper-personalization / Extreme | 30.4% | 23 |
| Fluent Prose / Hard | 27.5% | 80 |
| Hyper-personalization / Hard | 27.3% | 77 |
| Pretexting / Hard | 24.5% | 98 |
| Authority Impersonation / Hard | 22.2% | 99 |
Nearly one in three hyper-personalization emails at extreme difficulty bypassed detection. At the extreme tier, the gap between the hardest and easiest techniques to detect is 20 percentage points:
| Technique (Extreme only) | Detection Accuracy | n |
|---|---|---|
| Credential Harvest | 89.3% | 28 |
| Pretexting | 85.2% | 27 |
| Urgency | 85.2% | 27 |
| Authority Impersonation | 82.8% | 29 |
| Fluent Prose | 82.8% | 29 |
| Hyper-personalization | 69.6% | 23 |
Even at the highest difficulty tier, credential harvest remains the most detectable technique. Hyper-personalization is the only technique where detection drops below 70% at extreme. These cell sizes are small (23 to 29 observations) and the percentages are unstable, but the pattern is directionally consistent with the overall technique ordering.
The overconfidence problem
When participants missed a phishing email, 60.5% of the time they were CERTAIN they were right.
| Confidence | % of Phishing Misses | Count |
|---|---|---|
| CERTAIN | 60.5% | 179 |
| LIKELY | 28.7% | 85 |
| GUESSING | 10.8% | 32 |
This is not a case of people guessing wrong. It is a case of people being confidently wrong. The majority of phishing that bypasses detection does so with the participant feeling sure of their answer.
The pattern strengthened from the 100-participant snapshot, where 57.3% of misses were at CERTAIN confidence. At 153 participants, it is 60.5%.
The technique breakdown is where this gets interesting.
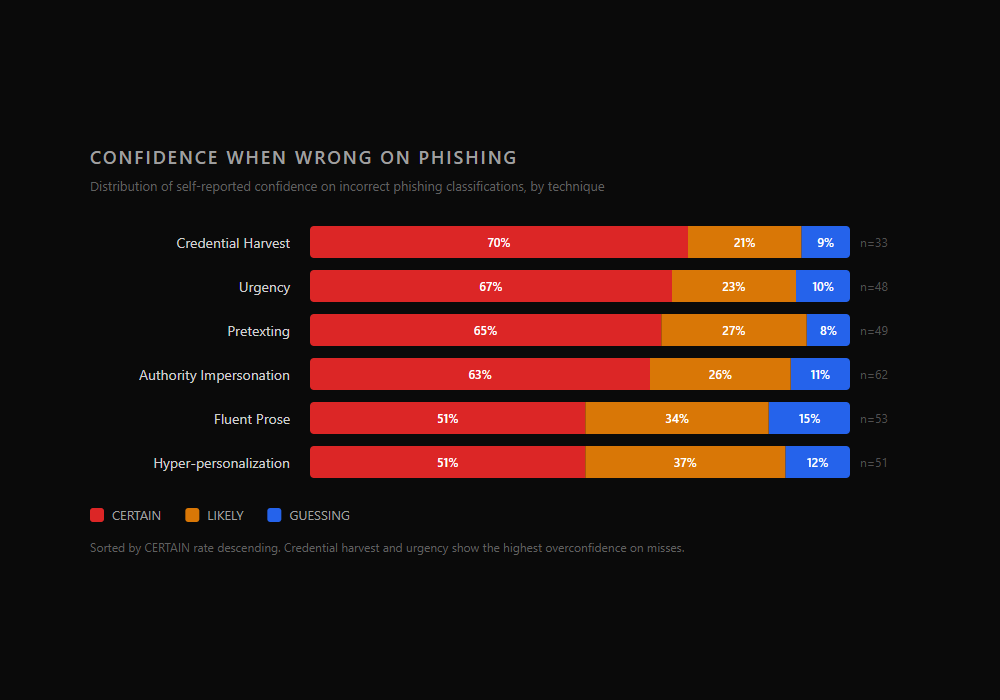
| Technique | % CERTAIN when wrong | n (misses) |
|---|---|---|
| Credential Harvest | 70% | 33 |
| Urgency | 67% | 48 |
| Pretexting | 65% | 49 |
| Authority Impersonation | 63% | 62 |
| Fluent Prose | 51% | 53 |
| Hyper-personalization | 51% | 51 |
Credential harvest and urgency, the two techniques most covered by security training, show the highest rates of confident incorrect answers. When participants miss these techniques, they almost always do so while feeling certain. This is a pattern worth investigating formally: familiarity with a technique category may create a false sense of mastery. When a well-crafted credential harvesting email bypasses initial pattern matching, the participant has no fallback heuristic and defaults to high confidence in their wrong answer.
Fluent prose and hyper-personalization sit at the other end at 51%. These techniques may produce more genuine uncertainty by design. When there is no obvious signal to match against, participants are more likely to hedge. Ironically, the techniques that generate the most misses also generate the most appropriate uncertainty on those misses.
The sample sizes per technique are small (33 to 62 misses per category), so these percentages are unstable. The formal confidence calibration analysis using ordinal regression will determine whether these patterns reflect genuine miscalibration or base rate effects.
Confidence calibration
| Confidence Level | Accuracy | n |
|---|---|---|
| GUESSING | 66.7% | 126 |
| LIKELY | 76.6% | 478 |
| CERTAIN | 88.1% | 1,907 |
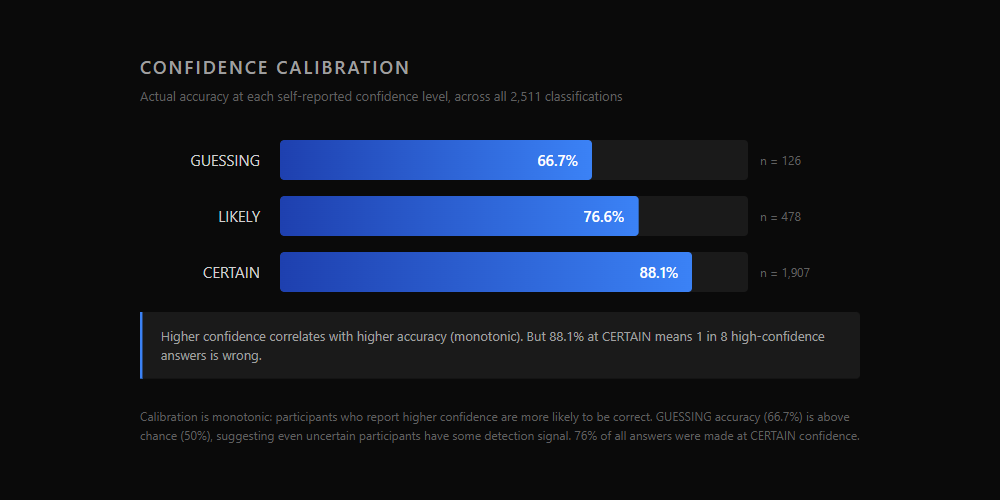
The calibration curve is monotonic: higher confidence correlates with higher accuracy. This is the minimum requirement for the instrument to be producing meaningful confidence data. If CERTAIN were less accurate than LIKELY, it would indicate a design problem.
But 88.1% accuracy at CERTAIN means roughly 1 in 8 high-confidence answers is wrong. In a security context, that gap is operationally significant. If an employee is certain an email is safe, they click without hesitation. A 12% error rate on "certain" classifications translates directly to confident, immediate action on phishing.
GUESSING accuracy of 66.7% is above chance (50%), suggesting that even uncertain participants have some detection signal. They are not randomly classifying. They know something is off but cannot articulate what.
The technique-level calibration data reveals one outlier worth noting. On fluent prose, participants who selected GUESSING achieved only 29% accuracy, well below chance. When people admit they are guessing on a fluent prose email, they are reliably wrong. This may indicate that fluent prose triggers a specific misperception: participants who cannot identify a technique assume the email is legitimate, and when they are uncertain enough to admit guessing, they lean toward "legitimate" as the default. No other technique shows below-chance GUESSING accuracy.
Professional background matters less than expected
| Background | Phishing Detection | n (phishing cards) |
|---|---|---|
| Technical / Non-security | 84.7% | 360 |
| Infosec / Cybersecurity | 84.2% | 748 |
| Other (general users) | 80.0% | 464 |
At 100 participants, infosec professionals led at 87.6%. At 153 participants, that has narrowed to 84.2%, and technical non-security professionals now edge ahead at 84.7%. The gap between the top and bottom groups is 4.7 percentage points. That is smaller than most people in the security field would expect.
Raw accuracy, however, masks two separate things happening at the same time. To see them, consider what an email classifier actually does. Every classification has two ways to be right and two ways to be wrong:
- Hit: correctly identifying a phishing email as phishing
- Miss: incorrectly calling a phishing email legitimate (the bypass rate)
- False alarm: incorrectly calling a legitimate email phishing
- Correct rejection: correctly identifying a legitimate email as legitimate
A participant who flags everything as phishing would catch 100% of phishing (perfect hit rate) but also flag every legitimate email (terrible false alarm rate). A participant who flags nothing would never false alarm but would miss all phishing. Raw accuracy blends these together. Two participants with the same accuracy score can have very different underlying patterns: one might be cautious and precise, the other aggressive and noisy.
Signal detection theory, a framework from psychophysics applied to phishing classification research by Canfield, Fischhoff, and Davis (2016), separates these into two independent measures. The intuition is easiest with an example.
Imagine two participants who both score about 85% accuracy in this study (where 69% of emails are phishing). Participant A catches 85% of phishing but also flags 14% of legitimate emails as phishing (aggressive). Participant B catches 80% of phishing and only flags 4% of legitimate emails (cautious). Nearly the same accuracy, very different behavior. One has a loose trigger and catches more phishing at the cost of more false alarms. The other is disciplined but lets more phishing through.
d-prime (d') captures the first difference: how well can you actually tell phishing from legitimate? It combines the hit rate (phishing correctly caught) and the false alarm rate (legitimate incorrectly flagged) into a single number. Higher d-prime means the participant is better at distinguishing the two, regardless of how aggressive or cautious they are. In the example above, Participant A might actually have a higher d-prime because the gap between their hit rate and false alarm rate is larger.
Criterion (c) captures the second difference: how willing are you to call something phishing? It is inferred from the pattern of hits and false alarms, not from observing a participant's reasoning directly. A positive criterion means the participant behaves as if they lean toward "legitimate" when uncertain. A criterion near zero means roughly neutral. Participant B has a higher criterion than Participant A.
The formulas, for those who want them:
d' = z(hit rate) - z(false alarm rate)
 c = -0.5 × [ z(hit rate) + z(false alarm rate) ]
Where z() converts a proportion to its standard normal deviate (the inverse of the bell curve). The math is less important than what it means: d-prime tells you how well someone can tell phishing from legitimate, and criterion tells you whether their pattern of answers leans toward flagging or toward letting things through.
What signal detection reveals
| Background | d-prime (ability to tell the difference) | Criterion c (tendency to flag as phishing) | Hit Rate (phishing caught) | False Positive Rate (legit flagged) |
|---|---|---|---|---|
| Infosec / Cybersecurity | 2.43 | 0.21 | 84.2% | 7.7% |
| Technical / Non-security | 2.29 | 0.12 | 84.7% | 10.4% |
| Other (general users) | 1.97 | 0.15 | 80.0% | 12.9% |
| Overall | 2.19 | 0.14 | 83.0% | 10.9% |
These values are computed from aggregate hit rates and false alarm rates within each group, consistent with the signal detection metrics specified in Section 7.1 of the study protocol. The formal analysis will compute per-participant d-prime values and compare group means, which is more robust than the aggregate approach used here. Additionally, the 69/31 phishing-to-legitimate ratio in the dataset may have influenced criterion values: participants who learned the base rate may have shifted toward flagging more emails as phishing. These criterion values reflect behavior within the study environment, not necessarily real-world thresholds.
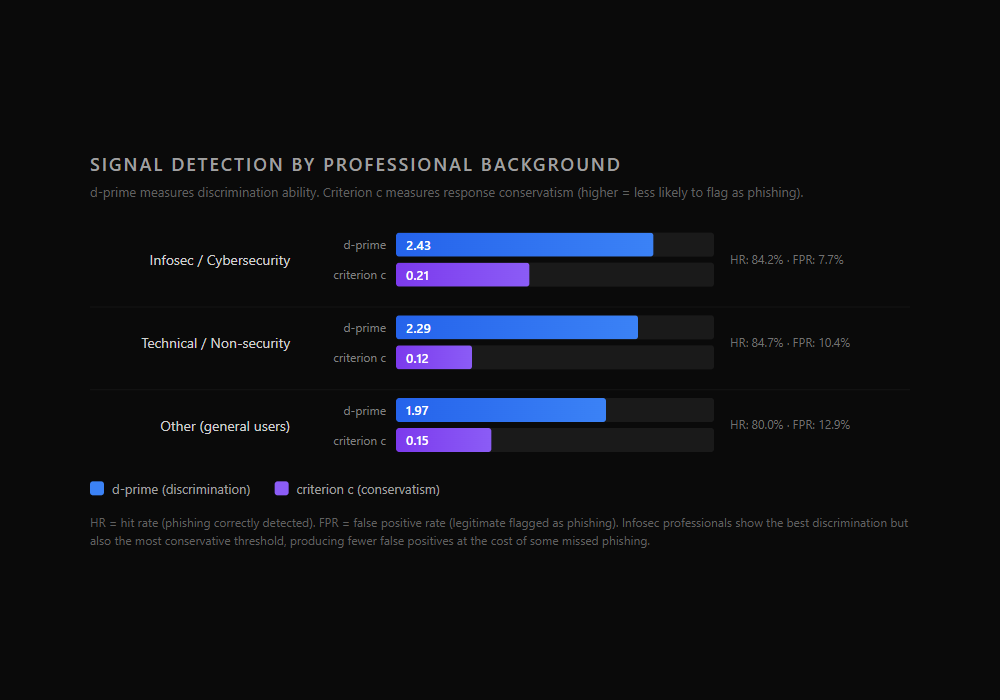
The raw accuracy gap between infosec (84.2%) and other (80.0%) is 4.2 percentage points. That understates the real difference. Infosec professionals have meaningfully better d-prime (2.43 vs. 1.97), meaning they are genuinely better at telling phishing from legitimate email. But they also have the highest criterion (c=0.21). Their answer pattern is consistent with defaulting to "legitimate" when uncertain: they catch most phishing but rarely flag legitimate email. This produces the lowest false positive rate in the dataset (7.7%), they rarely cry wolf, but it also means some phishing gets classified as legitimate.
The "other" group has a lower criterion (c=0.15) but also weaker d-prime (1.97). They are trying to be careful, but because they cannot distinguish phishing from legitimate as well, their caution does not prevent a higher false alarm rate (12.9%). They end up flagging more legitimate email by accident.
In raw accuracy, the infosec group's better discrimination is partially offset by their tendency to let borderline emails through, making the groups look more similar than they actually are.
The practical interpretation: security training correlates with both better discrimination (higher d-prime) and a more conservative answer pattern (higher criterion). Whether that trade-off is beneficial depends on the operational context. In environments where false positives are costly (blocking a legitimate client email), the infosec pattern is preferable. In high-threat environments where misses are costly, a more aggressive flagging pattern has its own logic.
Where each group struggles
| Technique | Infosec Bypass | Technical Bypass | Other Bypass |
|---|---|---|---|
| Authority Impersonation | 18.0% | 18.1% | 23.2% |
| Hyper-personalization | 17.9% | 15.4% | 25.3% |
| Fluent Prose | 15.1% | 19.2% | 26.4% |
| Urgency | 16.0% | 18.2% | 11.0% |
| Pretexting | 16.3% | 14.8% | 17.8% |
| Credential Harvest | 10.5% | 7.4% | 18.3% |
The "other" group shows the largest vulnerability to fluent prose (26.4%) and hyper-personalization (25.3%), both techniques where detection relies on contextual judgment rather than technical knowledge. Credential harvest shows the largest group gap: 7.4% bypass for technical professionals versus 18.3% for general users. This is where security training has its clearest effect.
One surprising pattern: general users show the lowest urgency bypass rate at 11.0%, below both infosec (16.0%) and technical (18.2%). This may be noise from small samples, or it may reflect a different response to artificial time pressure. These are unadjusted, self-reported, and unbalanced group comparisons. The formal interaction analysis will determine which differences are statistically meaningful.
A natural experiment on forensic signals
The protocol v1.1 addendum removed email authentication headers, Reply-To field analysis, and certain other forensic metadata from the interface on March 22, 2026. This created two data collection phases.
| Phase | Period | Answers | Players | Accuracy |
|---|---|---|---|---|
| Phase 1 (headers visible) | Before March 22 | 1,686 | 103 | 84.3% |
| Phase 2 (headers removed) | After March 22 | 825 | 53 | 85.9% |
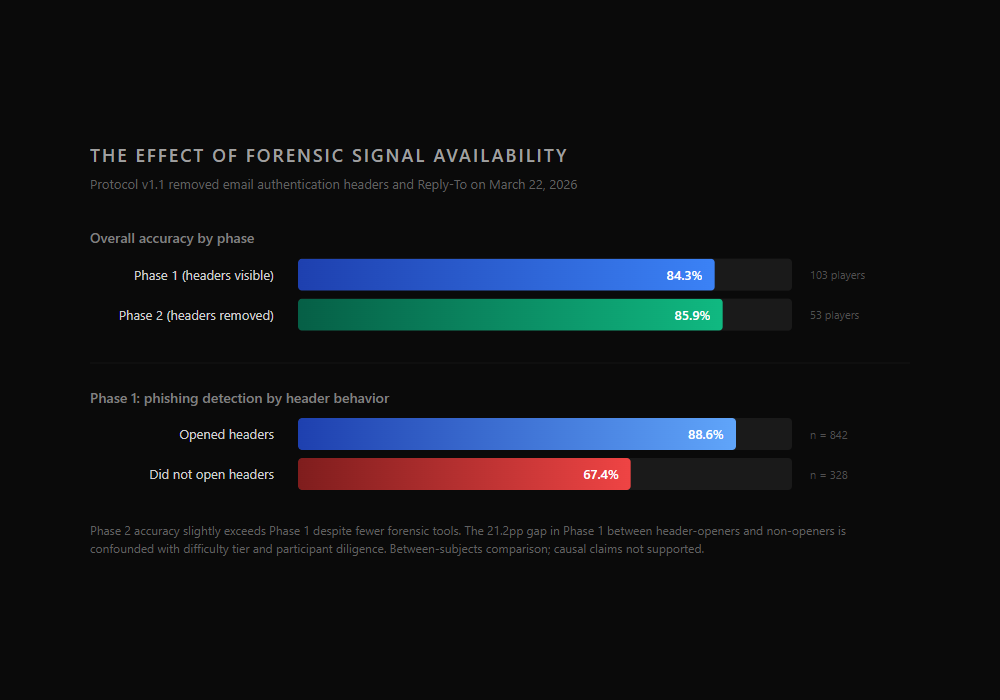
Phase 2 accuracy (85.9%) slightly exceeds Phase 1 (84.3%). That is the opposite of what you might expect if headers were helping people detect phishing.
Within Phase 1, the picture looks different:
| Header Behavior (Phase 1) | Phishing Detection | n |
|---|---|---|
| Opened headers | 88.6% | 842 |
| Did not open headers | 67.4% | 328 |
The 21.2 percentage point gap between header-openers and non-openers is the single largest behavioral effect in the dataset. But it is heavily confounded. Easy and medium phishing cards defaulted to failed authentication, making header inspection a near-deterministic shortcut for those tiers. Participants who check headers also tend to be more careful classifiers overall. The header-opening behavior is a proxy for forensic diligence, not necessarily a measure of header utility.
The authentication status data from Phase 1 directly supports the addendum's rationale:
| Auth Status (Phase 1 phishing) | Bypass Rate | n |
|---|---|---|
| Verified (pass) | 24.0% | 412 |
| Unverified (ambiguous) | 20.4% | 54 |
| Fail | 13.2% | 704 |
Phishing emails with verified authentication bypassed detection at nearly double the rate of those with failed authentication. When the badge says "verified," participants treated it as a legitimacy signal, even on phishing emails. This is the confound the addendum identified: authentication status was doing the classifying for easy/medium cards, and misleading participants on hard/extreme cards where attackers might configure authentication properly.
The paradox resolves if the header panel was primarily helping people who were already strong classifiers (giving them a shortcut they did not strictly need) while confusing or adding noise for weaker classifiers unfamiliar with email authentication concepts. Removing the panel eliminated both the shortcut and the noise, and the net effect was approximately neutral.
This is a between-subjects comparison (different cohorts in each phase), not a within-subjects design. Causal claims are not supported. The comparison is suggestive, not conclusive.
Forensic behavior and learning
Beyond headers, the dataset captures two other behavioral indicators: URL inspection and scroll depth.
| Behavior | Rate on Correct | Rate on Incorrect |
|---|---|---|
| URL inspected | 42.6% | 30.1% |
| Mean scroll depth | 40.9% | 53.6% |
Participants who inspected URLs were more likely to classify correctly (12.5pp gap). URL inspection is a concrete, interpretable action: seeing where a link actually goes provides direct evidence about a card's intent. This correlation is more robust than the header finding because URL destination is not confounded with difficulty tier in the same way authentication status is.
The URL inspection benefit varies substantially by technique:
| Technique | URL Inspected | Accuracy With | Accuracy Without | Gap |
|---|---|---|---|---|
| Authority Impersonation | 34% | 89% | 76% | +13pp |
| Urgency | 38% | 92% | 80% | +12pp |
| Credential Harvest | 57% | 91% | 84% | +7pp |
| Pretexting | 26% | 88% | 82% | +6pp |
| Hyper-personalization | 45% | 82% | 79% | +3pp |
| Fluent Prose | 46% | 81% | 80% | +1pp |
URL inspection produces the largest accuracy lift for authority impersonation (+13pp) and urgency (+12pp), where suspicious URLs provide direct evidence of intent. For fluent prose, the benefit is nearly zero (+1pp). This makes sense: fluent prose phishing often uses plausible-looking URLs that do not obviously betray the email's purpose. The technique is designed to lack identifiable signals, and URL structure is one of those signals.
The scroll depth finding runs counter to intuition. Incorrect answers are associated with deeper scrolling (53.6% vs. 40.9%). This likely reflects the same pattern found in the timing data: ambiguous or misleading emails cause more browsing behavior. Scrolling does not cause errors. Confusion causes both scrolling and errors.
Learning across sessions
| Session | Accuracy | n |
|---|---|---|
| Session 1 (cards 1-10) | 83.1% | 1,271 |
| Session 2 (cards 11-20) | 86.8% | 699 |
| Session 3 (cards 21-30) | 86.5% | 541 |
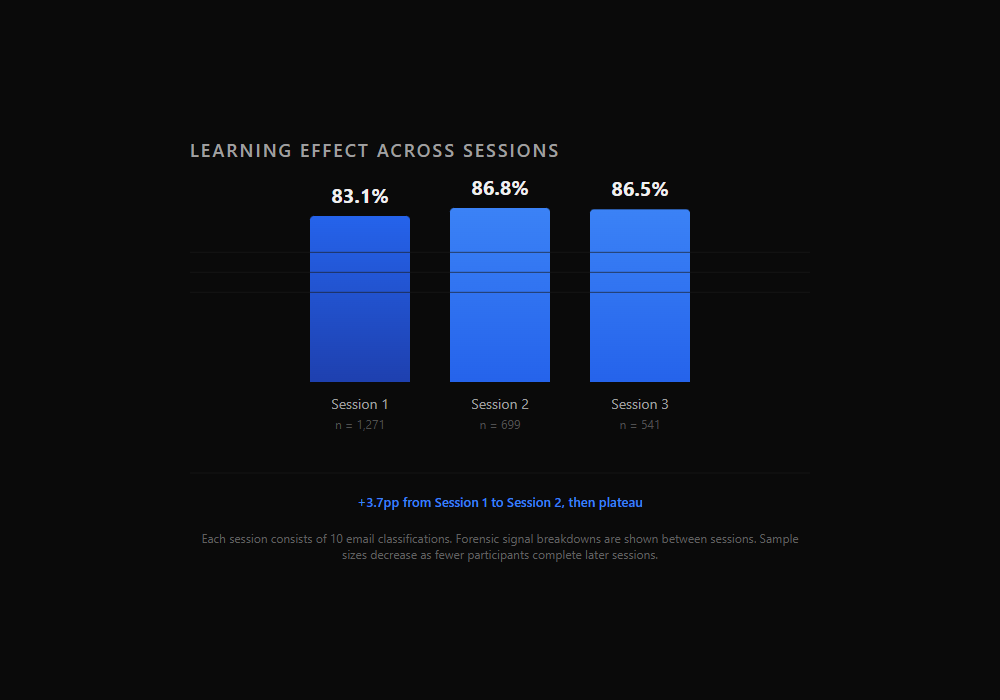
Accuracy improves 3.7 percentage points from Session 1 to Session 2, then plateaus. Participants receive forensic signal breakdowns between sessions, and this feedback appears to produce a measurable learning effect. The plateau at Session 3 may indicate a ceiling effect, or it may reflect the smaller and more self-selected sample that reaches Session 3 (participants who complete all 30 cards are a subset of those who start).
Completion depth (how many cards a participant classifies) correlates with accuracy:
| Completion Depth | Mean Accuracy | Players |
|---|---|---|
| 1-10 answers | 77.9% | 75 |
| 11-20 answers | 83.3% | 22 |
| 21-30 answers | 85.7% | 56 |
This could be a learning effect (more practice improves performance), a selection effect (better classifiers are more engaged and complete more cards), or both. The mixed-effects model with participant-level random intercepts will help disentangle these.
This learning trajectory is relevant to the game-based training thesis. If the instrument produces measurable improvement within three sessions, it supports the argument that structured practice with feedback improves phishing detection, at least in a controlled assessment context.
Time spent does not predict accuracy
| Metric | Correct | Incorrect |
|---|---|---|
| Median time | 37.4s | 41.7s |
| Mean time | 73.0s | 71.4s |
The difference between correct and incorrect answers is small and in the wrong direction for the "slow down" hypothesis. Wrong answers take slightly longer, not shorter. This pattern was present in the pilot data at 56 participants and persists at 153.
| Technique | Median Time |
|---|---|
| Credential Harvest | 29.9s |
| Pretexting | 33.4s |
| Urgency | 35.2s |
| Authority Impersonation | 37.6s |
| Hyper-personalization | 37.8s |
| Fluent Prose | 38.6s |
Credential harvest, the easiest technique to detect, is also the fastest to classify. Fluent prose, tied for the hardest, is the slowest. The techniques that produce more deliberation also produce more errors. This is consistent with a model where detection is primarily pattern recognition: when the pattern is clear (credential harvest has a structural fingerprint), classification is fast and accurate. When no pattern is available (fluent prose is defined by the absence of identifiable technique markers), participants take longer and still get it wrong more often.
"Slow down and think carefully" is common security advice. The data does not support it. When a phishing email requires deliberation, the extra time does not improve outcomes. The emails people get wrong are not the ones they rush through. They are the ones that genuinely look legitimate.
Phase 2 tells a cleaner story
Phase 2 data (post-header-removal) is the cleanest measurement of the intended construct: technique-level detection from email content alone, without forensic metadata shortcuts.
| Technique (Phase 2) | Bypass Rate | n |
|---|---|---|
| Authority Impersonation | 20.5% | 117 |
| Urgency | 16.8% | 107 |
| Pretexting | 16.3% | 92 |
| Fluent Prose | 16.2% | 80 |
| Hyper-personalization | 14.5% | 76 |
| Credential Harvest | 12.5% | 96 |
The ordering shifts. Authority impersonation becomes the clear leader at 20.5% when headers are removed. In Phase 1, participants who checked headers could catch authority impersonation via authentication failures (impersonated senders often fail SPF/DKIM). Without that shortcut, authority impersonation reveals its content-level difficulty: the deference to authority that makes it effective in the real world also makes it hard to detect from email content alone.
Fluent prose and hyper-personalization drop from near the top to the middle. This suggests that some of their overall bypass rate may have been driven by their interaction with the header system in Phase 1 rather than pure content difficulty.
Phase 2 also produces a provocative group comparison. Overall accuracy by background in Phase 2:
| Background (Phase 2) | Accuracy | n |
|---|---|---|
| Other (general users) | 90.0% | 150 |
| Technical / Non-security | 87.0% | 193 |
| Infosec / Cybersecurity | 85.3% | 409 |
General users outperform security professionals in Phase 2. The sample is small (150 vs. 409), the groups may differ systematically, and this could easily be noise. But it is worth flagging as a pattern for the formal analysis to investigate. Multiple explanations are possible: cohort composition differences, the specific card mix encountered by Phase 2 participants, or a genuine interaction between background and the availability of forensic tools. The formal model with participant-level random effects and a phase-by-background interaction term will be needed to determine whether this pattern is real.
How the pattern has stabilized
| Metric | n=56 | n=100 | n=153 |
|---|---|---|---|
| Overall accuracy | 87.3% | 84.6% | 84.9% |
| Top technique (bypass) | Fluent Prose (21.3%) | Hyper-personalization (21.6%) | Hyper-personalization (19.8%) |
| Bottom technique (bypass) | Credential Harvest (6.2%) | Credential Harvest (12.2%) | Credential Harvest (12.1%) |
| CERTAIN when wrong | ~57% | 57.3% | 60.5% |
| Infosec accuracy | 87.9% | 87.6% | 84.2% |
| False positive rate | 8.4% | 11.8% | 10.9% |
The headline accuracy has stabilized around 85%. The technique ordering is consistent across all three snapshots, with fluent prose, hyper-personalization, and authority impersonation at the top and credential harvest at the bottom. The overconfidence pattern has strengthened. The infosec advantage has narrowed (likely regression to the mean as the sample grows and diversifies).
The stability itself is a finding. Three successive snapshots with increasing sample sizes have produced the same structural pattern. This does not prove the pattern is real (that requires the formal analysis), but it reduces the probability that it is an artifact of a small early sample.
Limitations
This section is long because the limitations are real and consequential for interpretation.
Descriptive only. No inferential statistics have been run. All patterns may shift or collapse once the mixed-effects model accounts for participant-level variation, card-level difficulty, and within-study learning.
Self-selected convenience sample. Participants chose to play a phishing detection game. This over-represents people with above-average security awareness. Absolute detection rates should not be compared to real-world phishing simulation click rates.
Unverified self-reported backgrounds. The infosec/technical/other categorization is based on participant self-report with no verification. Group comparisons should be treated as approximate.
AI-generated stimuli. All cards are AI-generated. Legitimate emails lack the contextual richness of real correspondence (knowing the sender, expecting the email, recognizing internal references). Detection rates for legitimate emails should not be read as reflecting real-world false positive rates.
Phase change confound. The removal of headers mid-study means Phase 1 and Phase 2 data are not directly comparable without controls. Phase 2 participants are a different cohort, not the same people tested under different conditions.
Small cell sizes. Technique-by-difficulty interaction cells and per-technique confidence breakdowns have small denominators (as few as 23 observations). Percentages in these breakdowns are unstable and should be treated as directional.
No card-level random effects. Some individual cards may be outlier-easy or outlier-hard in ways that are not captured by their technique and difficulty labels. The mixed-effects model with card-level random intercepts will absorb this variance.
Within-study learning. Participants who complete more sessions have both more data and more experience. The learning effect documented above is both a finding and a confound.
Game context. Participants know they are classifying emails in a game. This focuses attention in a way that real-world email triage does not. Game-context detection rates are inflated relative to real-world performance.
Base rate. The 69/31 phishing-to-legitimate ratio is a design choice for statistical power, not a reflection of real email. Participants may develop phishing-biased classification strategies. Signal detection metrics (d-prime, criterion) partially address this.
What this means for security awareness training
These are directions for investigation based on descriptive patterns, not prescriptions based on confirmed findings.
Training emphasis may be inverted. The two techniques most covered by security awareness programs (credential harvest, urgency) are the two participants detect most reliably. The techniques that training spends less time on (fluent prose, hyper-personalization, authority impersonation) produce the highest bypass rates. This does not mean training caused the good performance on credential harvest. It could be that credential harvest is inherently easier to detect. But the gap between where training focuses and where detection fails is worth examining.
Overconfidence may be the more important vulnerability. The bypass rate tells you how often phishing gets through. The overconfidence pattern tells you what happens next. When a phishing email bypasses detection with the recipient feeling CERTAIN it was safe, there is no second-guessing. No pause before clicking. The 60.5% CERTAIN-when-wrong rate means most phishing that gets through produces confident, immediate action. Training that addresses calibration, knowing when you do not know, may be more valuable than training that addresses detection alone.
URL inspection correlates with accuracy more robustly than header analysis. Training people to inspect where links actually go may be more durable than training them on authentication headers, which requires technical knowledge many users lack and can mislead when attackers configure SPF/DKIM properly on domains they control.
AI-quality phishing narrows the expert advantage. The d-prime analysis shows security professionals have genuinely better discrimination (d'=2.43 vs. 1.97), but the gap is smaller than the field typically assumes. Against AI-quality stimuli that remove the easy linguistic signals, professional experience provides less lift than it does against traditional phishing.
Game-based training produces measurable learning. The 3.7pp improvement from Session 1 to Session 2 is a within-platform signal that structured practice with feedback improves detection. Whether this transfers to real-world email triage is an open question, but the learning effect is present in the data.
What comes next
The target is 300+ participants before running the formal model. The reasoning is unchanged from the 100-participant post: subgroup analysis needs larger groups, technique-level confidence intervals need tightening, the card-level random intercept needs more per-card observations, and the technique-by-ordinal interaction (do learning rates differ by technique?) needs more degrees of freedom.
The formal analysis plan from the study protocol:
- Mixed-effects logistic regression with technique and difficulty as fixed effects, participant and card as random intercepts
- Pairwise technique comparisons with Bonferroni correction
- Signal detection metrics (d-prime and criterion) to separate discriminability from response bias
- Technique-by-background interaction for group differences
- Confidence calibration analysis using ordinal regression
- Full empirical findings paper for Zenodo publication, with the dataset released alongside it
Update (April 3, 2026): The preliminary empirical findings described in this post have been formally published on Zenodo: doi.org/10.5281/zenodo.19410549
Data collection is ongoing. If you want to contribute:
After completing Research Mode, you unlock a live intel dashboard showing participant count, technique-level bypass rates, and a background crosstab.
The full study protocol: doi.org/10.5281/zenodo.19059296
More posts
The Action Pause: A 10-Second Habit for AI-Era Impersonation
A behavioral framework for AI-era impersonation across email, voice, video, chat, and in-person asks. Empirically grounded in 2,511 classifications from the Threat Terminal study. Trigger on the action request, not on the content.
Threat Terminal v2.0: PvP Is Here
Real-time 1v1 ranked matches, a new unlock ladder, and a terminal AI that will not stop talking. Threat Terminal v2.0 goes live tonight.
Stay in the loop
I write about the security topics that interest me: IAM, cloud security, automation, threat intelligence, phishing, and incident response. If this was useful, there is more where it came from.